Reports
Reports overview
A tour of Reports — money, labor, inventory, and work rolled up into one place, ready to export.
Reports pulls numbers from every part of CRMb — invoicing, Punch, Inventory and Pipeline — into one place. Summary gives you the headline metrics for a period you pick. All is the report library: every report CRMb has, sorted into four tiers. Whatever you're looking at can be exported in a handful of formats.
Reports is for owners and managers. It is also one of the two places an accountant you have added as a CPA can work.
Step 1 — The Reports Summary at a glance
Along the top right sit the Summary / All switch, Refresh, Export, and then the period: Week, Month, Quarter, Year, and a Custom pill beside them. The period drives the whole page and every export, and it starts on Month. Custom opens a small From / To panel — there is no Apply button, so the page moves the moment both dates are filled in. Refresh pulls the latest numbers on demand.
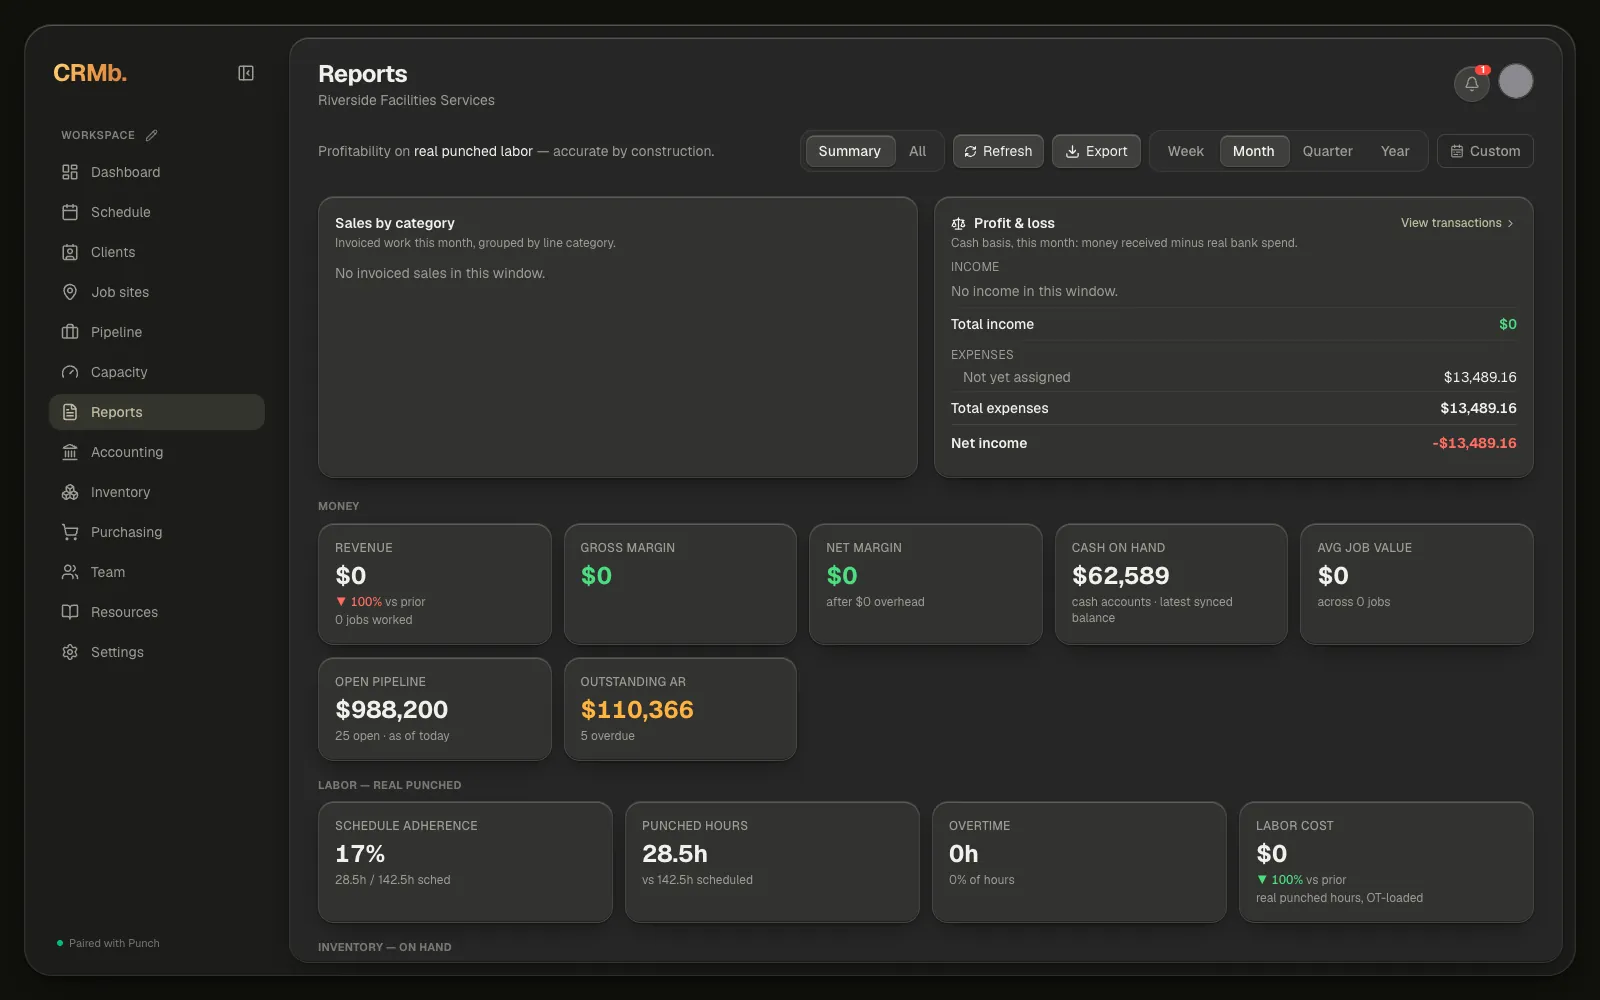
The metrics come in groups, each a row of stat cards for the period you have selected:
- Money — Revenue, Gross margin, Net margin, Cash on hand, Avg job value, Open pipeline, and Outstanding AR. Net margin and Cash on hand appear only once you have a bank connected in Accounting.
- Labor — real punched — schedule adherence, punched hours against what was scheduled, overtime, and labor cost.
- Inventory — on hand — total on-hand value, items low or out of stock, and your top item by value. The whole group appears only once you have items with stock tracked.
- Work — tasks & epics — tasks completed and created this period, what's in progress, and what's overdue.
Above the stat cards, Sales by category breaks down invoiced work by line-item category, and Profit & loss shows cash-basis income and spend for the period. The whole Profit & loss card is a link — its top corner reads View transactions — and it opens the transactions behind those figures for the same period.
Step 2 — Browse every report
Switch to the All tab to see the whole report library, organized into four tiers: Tier 1 — Core, then high-frequency operational, periodic management, and specialized reports underneath.
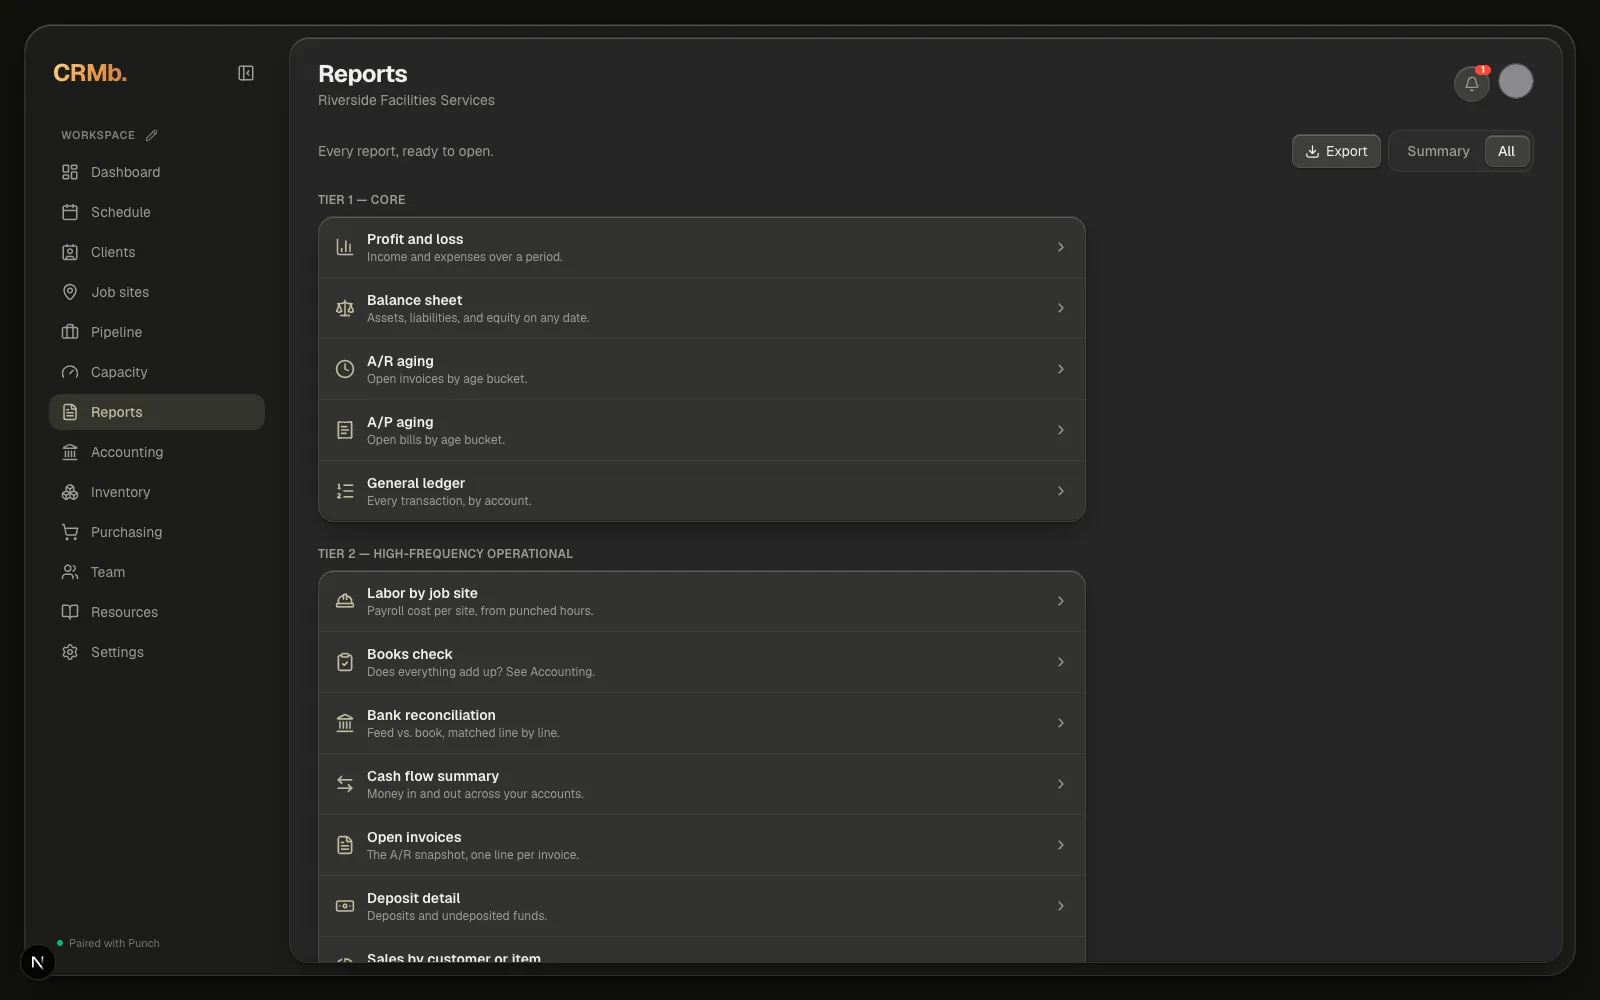
Tier 1 — Core covers the fundamentals every business needs. A/R aging is there for every manager, and Profit and loss, Balance sheet, A/P aging and the General ledger are listed for people who have access to Accounting. Click any of those rows to open that report on its own. Further down, eight more open: Labor by job site — payroll cost per site from punched hours — along with Open invoices, Sales by customer or item and Sales tax liability, plus Books check, Bank reconciliation, Cash flow summary and Deposit detail, which are listed for people who have access to Accounting. Four more open under Tier 3 — Periodic management: Budget vs. actuals, P&L prior-period comparison, P&L by job and Balance sheet comparison, which are listed for people who have access to Accounting. Balance sheet comparison shows where the business stood at the end of the period you picked beside where it stood the day before that period began, and the Balance sheet itself now has an As of date you can move. Under Tier 4 — Specialized, Open purchase orders and Inventory valuation summary open when your workspace has the Inventory add-on; without it those two rows are not listed. In a US workspace, Payroll summary (941 prep) and 1099 contractor payments are listed for the owner and for a CPA: the first adds up each quarter's wages person by person, ready for your payroll provider, and the second lists every payout to 1099 contractors and people with no tax type, with each person's total for the year. Every row on the list opens. Fixed asset schedule is deliberately absent — CRMb keeps no asset register, and one typed in by hand would be bookkeeping, not automation. Budget vs. actuals compares a monthly amount you set for each line — in Accounting, under Rules — against what the profit and loss actually recorded; the budget covers every calendar month the window touches, each month whole.
Each report you open carries its own Export button, which saves exactly the grid you are looking at as a CSV.
Note — The Export menu sits on this tab too, not only on Summary.
Step 3 — Export your reports
Click Export in the top right to choose a format: a full Report pack (PDF), a Workbook (Excel), an Exec deck (PowerPoint), or Raw data (CSV).
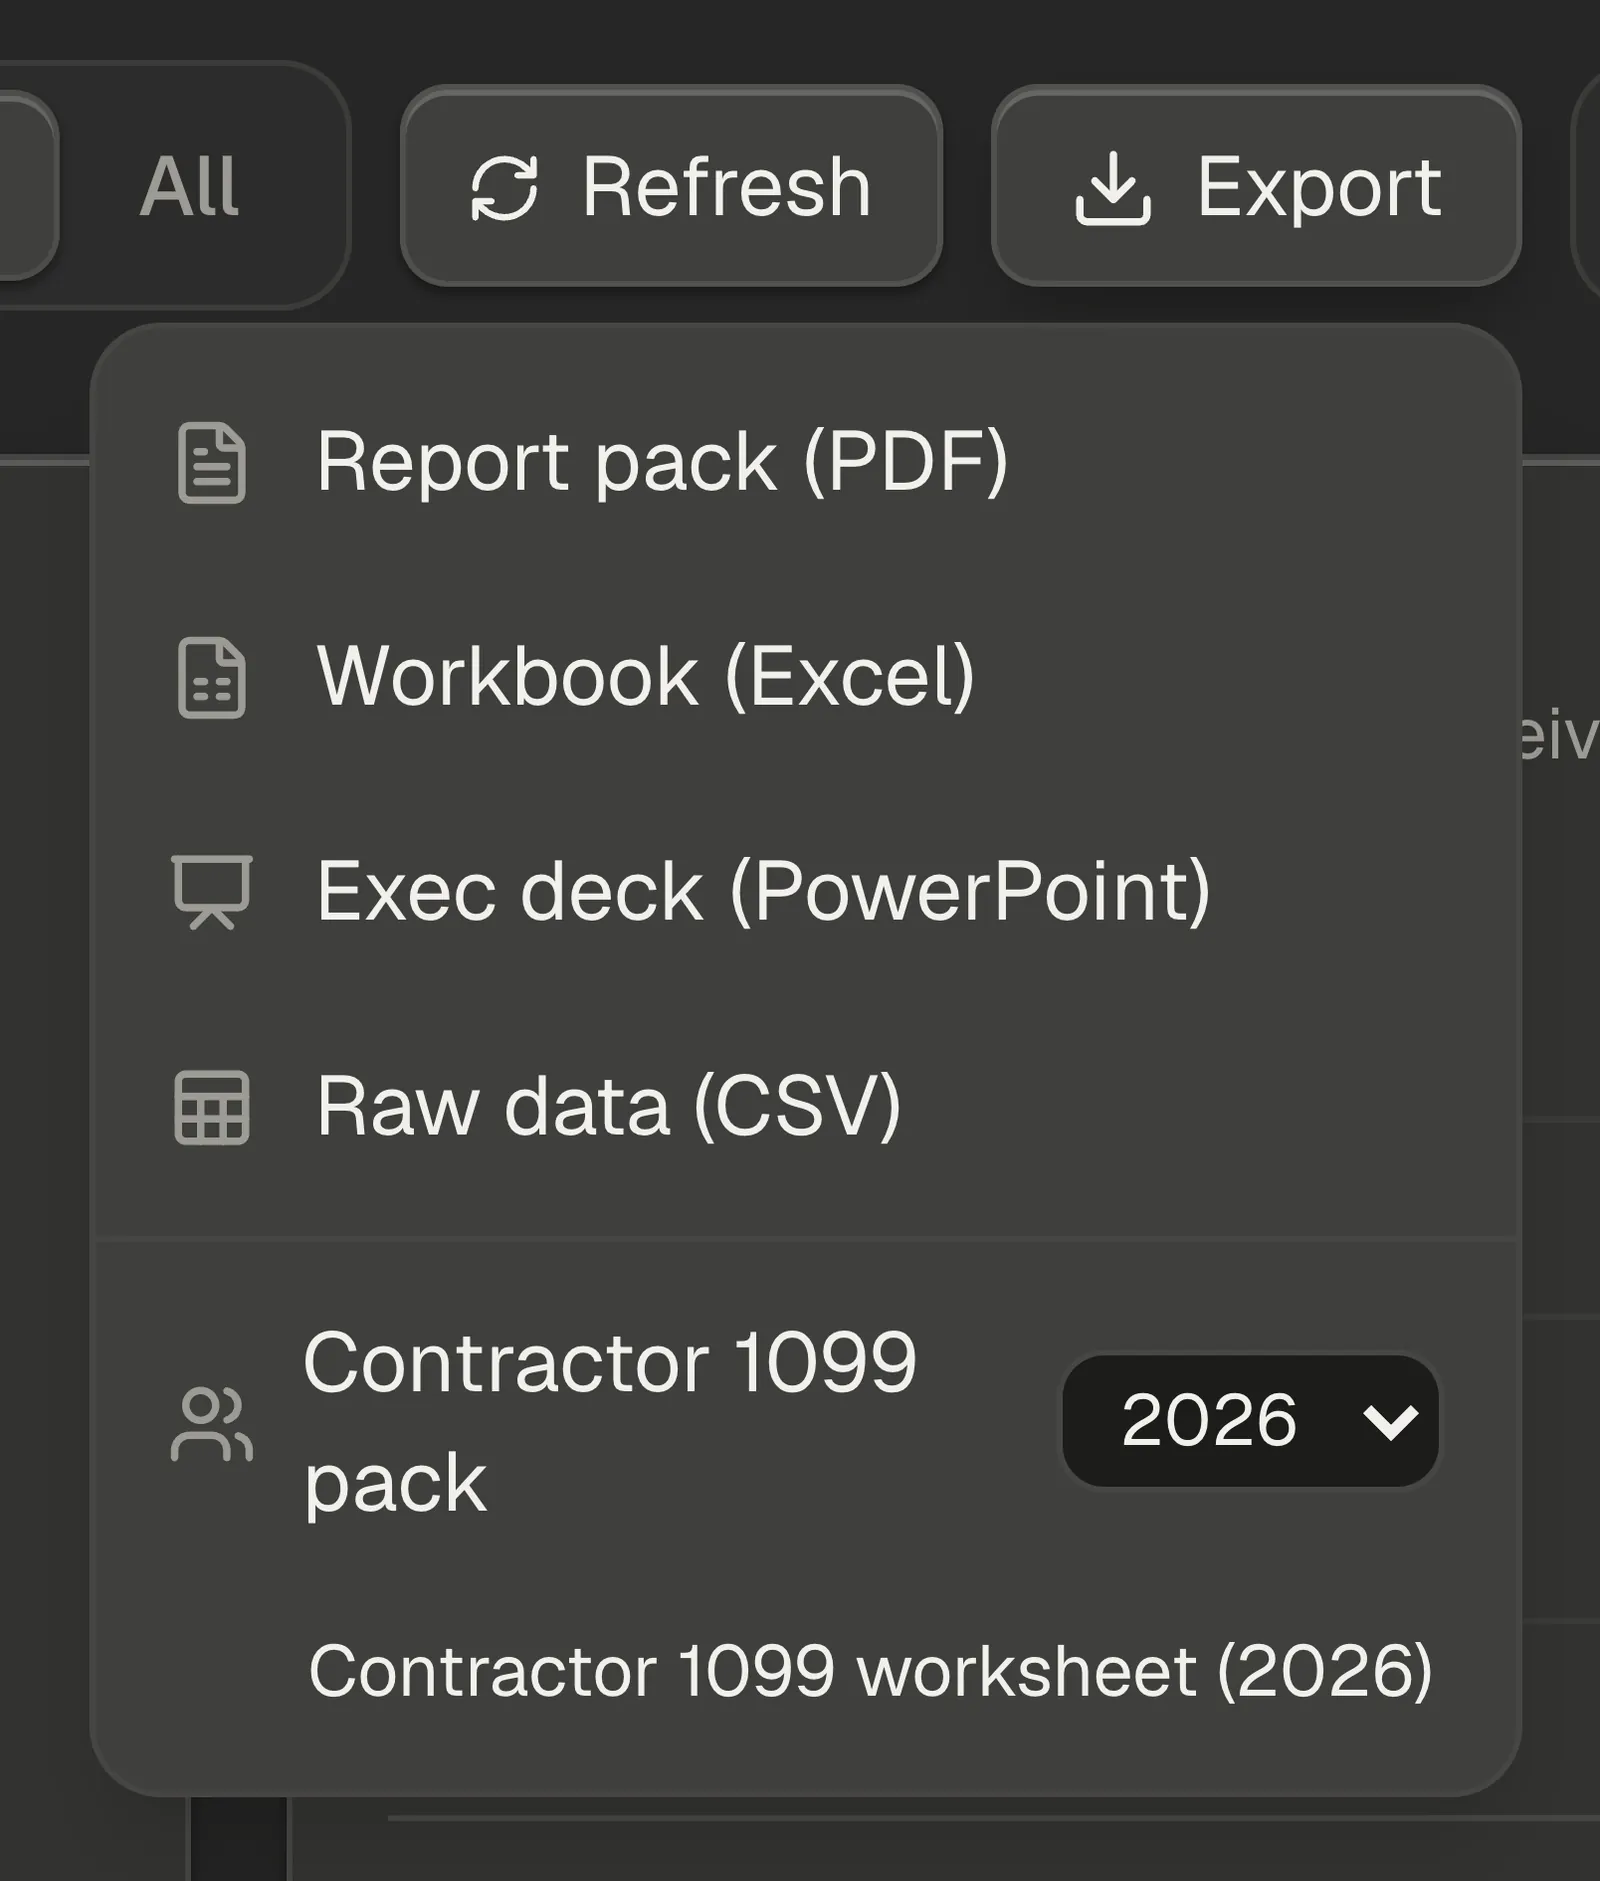
If you're the owner of a US workspace, the menu carries one more section: Contractor 1099 pack. Pick the tax year from the dropdown beside it, then choose the Contractor 1099 worksheet row underneath. Managers don't see this section. The worksheet's nonemployee compensation — Box 1a of the 2026 Form 1099-NEC and later, Box 1 on the 2025 form and earlier — is the same figure as the 1099 contractor payments report.
Note — Set your period on Summary before you export. Switching to All resets the period back to Month, and the All tab carries only the tab switch and the Export menu — the period buttons and Refresh live on Summary. One export behaves differently on All: Report pack (PDF) prints the page you're looking at, so there it reads on Summary and takes you back to Summary to print. Every other format is the same file from either tab.
Note — The Contractor 1099 pack ignores the period entirely. It always covers the full tax year you pick from its own dropdown.